Measuring and monitoring a key to success
Some people will think that I am going to talk about Service Level Indicator (SLIs) and how important they are for safeguarding of our digital solutions. SLIs are important, but it’s not what this blog is about. I want to give you an example of people working together to reduce energy consumption. I’ll explain how we, at Montpellier Technology Center (MpTC), have reduced our energy consumption by at least 20% year-on-year (YOY) every quarter, by mainly looking at the numbers.
Context
SLB has joined the journey to reduce the planet’s CO2 emissions. SLB France signed the EcoWatch charter mid-2022, ‘for an energy consumption that is reasonable and responsible’ leading to an attempt to reduce our electrical consumption by 10% YoY. So, the good folks of MpTC decided to look into doing their part. But how?
The set-up
A broad selection of the team was invited into a meeting to brainstorm ideas and propose solutions. Everyone had their own opinion on the sources of major consumption. The air conditioning (AC) and heating system was of course a designated culprit—we are in the South of France after all—people often complained about having to turn it off because it was too cold or too noisy. At that point, no one knew how the system worked and how to make it smarter, so we decided to investigate. A team of four volunteered to look into how the system could be optimized (aka building management system (BMS) or GTB in French), by first looking into the data, ensuring its accuracy, and then understanding our consumption patterns.
Surprise surprise
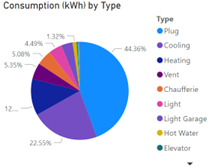
I know you saw it coming, but despite the AC being the ideal culprit it is not the biggest energy consumer in a digital technology center. Our screens and laptops are the first source of consumption (about 44% average from 2016 to 2021). A standard MpTC setup (one laptop, two screens and one docking station) consumes around 200 Watts, 150 Watts when the screen is locked and 25 W if the computer goes to sleep. This averages 1.5 kWh during an eight-hour shift.
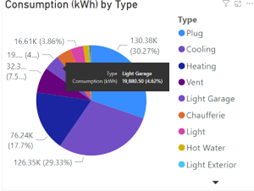 One of our key findings was that we were able to identify sources of abnormal consumption within our building, such as our garage lighting system reaching 20 MWh in 2021(4.6% of our yearly consumption).
While we were focusing some of our efforts to gain control of the AC system, we also looked at quick wins.
Data is key
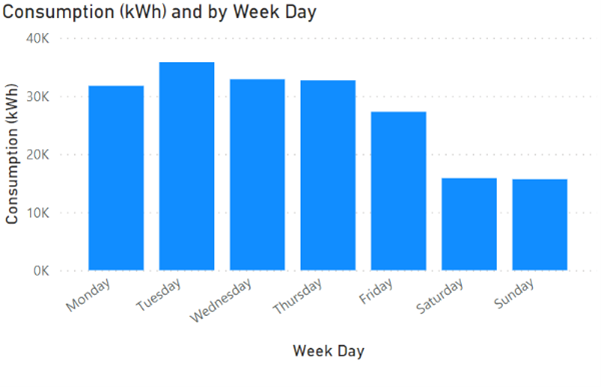
One would say that is normal that our machinery consumes electricity, and we can’t reduce it.
True, however, should we still consume about 260 kwh during weekend days, when we consume about 500 kwh on weekdays? Our standard MpTC setup consumes 25 Watts in sleep, four Watts in hibernate mode and three Watts with laptop off. In the best-case scenario, where people turn off their computer for the evenings and weekend, this still represents a consumption of 400 Wh per week per station (5% of the weekly consumption of a MpTC standard station).
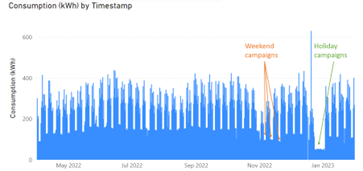
To improve this, we launched several “unplug” campaigns for people to be aware of the cost of our standard stations during the weekends (evenings, vacation, working from home days…). The success shown in the graph led us to acquire plugs with switches to make it easier for people to turn it off daily. When the office was closed for the holiday season, we also turned off all the meeting rooms, we are investigating how to shut them down outside of working hours.
The monitoring helped us assess our campaigns and confirmed they were successful, while indicating that refreshers are needed to transform into a habit.
20% and counting
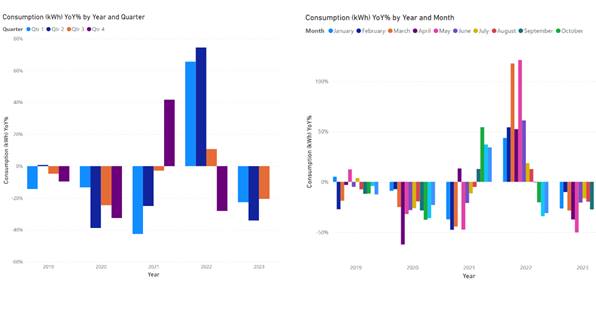
Since we introduced this monitoring and took actions to reduce, we were able to get 20% YoY every quarter (and almost every month). At every step we implemented, we took time to ensure our changes would go in the right direction, then look at the new data and thought about how to improve further. The scientists in our team are happy as we are now reaching the optimization phase. We are considering how we achieve even more using modeling or machine learning (ML).
What about costs?
It is right to ask the question about costs—We want to highlight that during this first year, the cost was limited to the time we invested from our other duties and the purchase of plugs with and on/off switch. We have purposely delayed any machinery or technology upgrade, as we wanted to optimize usage patterns first. We are however considering some for 2024 as they could help us go further.
We did have the advantage that our BMS already gave us a breakdown. If your facility does not have it, you would need to invest, but the gain outweighs the cost. The investment can be made gradually, for example by segregating by type first, then location. It will depend on your location and your goals.
What about the AC?
 Well, the story about the AC is fascinating and contributed a lot to our achievements, but it is too long to explain in detail within this blog post. In short, after diving into LonWorks protocols we were able to understand which attributes of the controllers needed to be reprogrammed, applied the changes to a few offices, and after seeing the effect, scaled-it out to the entire building.
This led to the lowest consumption of the cooling system for several years.
For more details, feel free to reach out to us.